The most dangerous failure is a clean run
The most common mistake teams make when moving a LangGraph pipeline to production is assuming that a successful exit means a correct result. It does not. A graph can traverse every node, satisfy every edge condition, and write a final output -- all without triggering any error or alert -- while quietly taking the wrong path through the logic it was built to execute.
This is not a theoretical concern. Production AI systems fail in this mode routinely, and it is the failure mode most monitoring setups are not designed to catch. The standard observability stack answers one question: did the pipeline run? It does not answer the harder question: did the pipeline run correctly? Those are different questions, and closing the gap between them requires a different layer of instrumentation.
The "completes but drifts" failure mode
A traditional software failure is visible. An exception propagates, a process crashes, an alert fires. The failure is discrete, locatable, and traceable. The failure mode that makes agentic pipelines genuinely difficult to operate looks nothing like this.
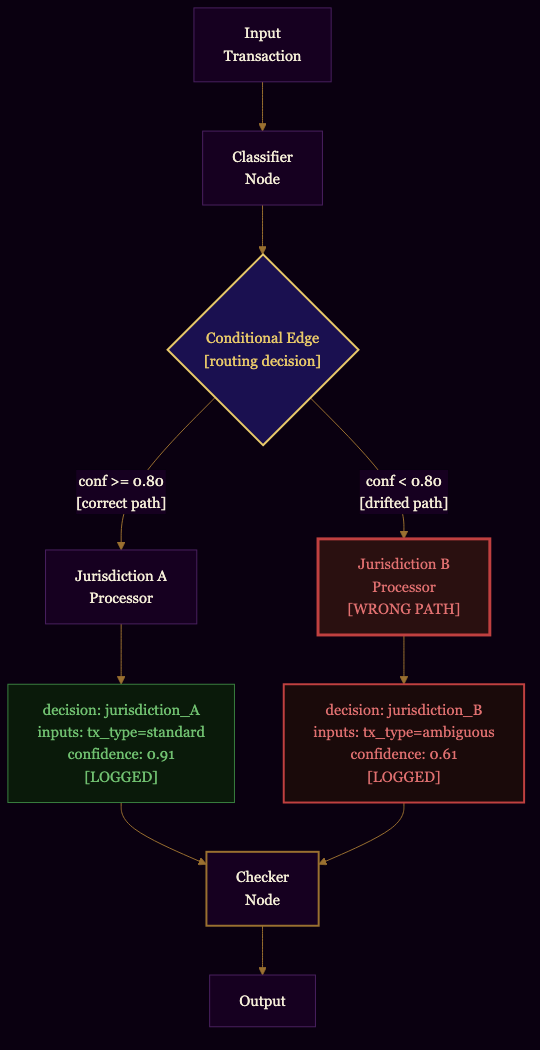
In a LangGraph pipeline, the failure is often a routing decision that was never wrong enough to fail a check but was systematically off in a way that compounded over time. Classification confidence drifts slightly as input distributions shift. Retrieval quality degrades when an upstream source changes its schema. A model's behavior shifts with a temperature change or a prompt update. None of these trigger a graph exception. Each run still finishes, still writes an output, still shows green. The system reports success. What it cannot report is that the graph has been taking the jurisdiction-misclassification path for the last three weeks.
The 19-node financial pipeline we built for a client is a useful example. It processes transactions across seven data sources, classifying each by type, applicable tax jurisdiction, and accounting rules. The graph runs unattended against live data. On any given run, the graph exits cleanly. The question the original monitoring setup could not answer was whether the classifier was applying the right jurisdiction context to ambiguous transactions -- not whether it was calculating correctly given that context, but whether the upstream classification decision that set the context was right in the first place.
That distinction matters. You can have a perfectly correct formula running on the wrong inputs. The graph will complete. The output will look plausible. The error is invisible unless you have instrumented the decision that set the inputs.
Routing decisions as data, not control flow
The reframe that changes how you approach this problem: a conditional edge in a LangGraph graph is not just control flow. It is a decision -- one made by a probabilistic model, under conditions that will change over time, for reasons that should be inspectable after the fact.
A reader named Mateo Ruiz made this point sharply in a comment on the first post in this series. His observation was that state snapshots at critical checkpoints, edge-traversal metrics, and routing-decision logging are underdiscussed relative to their importance -- and that many production incidents are not crashes at all. The graph executes successfully but gradually starts taking unexpected paths because classification confidence, retrieval quality, or model behavior drifts over time.
That framing is exactly right, and it points to a concrete design principle: persist the routing decision as data. At each conditional edge, log not just which path was taken, but the inputs that drove the decision and the model's confidence in it. The difference is between a system that tells you "it went to node B" and one that tells you "it went to node B because the classifier returned jurisdiction=California with a mid-range confidence score, given these three input features." The first answer tells you what happened. The second tells you why -- and why is what you need when you're trying to understand whether the decision was right.
When routing decisions are stored as structured data, the question "why did it take this path three weeks into runtime?" becomes a query, not an archaeology project. You can ask which inputs correlate with low-confidence decisions, which nodes are seeing the highest variance in their routing distributions, and whether there are patterns in the cases that later needed correction.
What to instrument
The practical instrumentation work falls into four areas.
State snapshots at critical checkpoints give you a timestamped record of the shared context flowing through the graph at the moments that matter most: before and after high-stakes nodes, at the entry point of any human review gate, and wherever the graph can take branches with meaningfully different downstream consequences. The snapshot should capture the full state object, not just the delta -- you want the complete picture of what the model saw, not just what changed.
Edge-traversal metrics tell you which paths through the graph are actually being taken versus which ones you designed for. A conditional edge that routes 98 percent of traffic one direction and 2 percent the other is a very different system in production than one that splits 60/40. Tracking traversal counts and distributions over time surfaces routing drift before it becomes a pattern you are explaining after the fact.
Routing-decision logging, as described above, captures the inputs and confidence for each conditional branch. This is where the decision lives: the prompt that was sent, the model's response, the parsed output that drove the routing logic. Without it, you cannot tell the difference between a correct low-confidence decision and an incorrect high-confidence one.
Node-level latency and token tracking close the loop on operational costs and quality signals. Nodes that are slowing down or consuming more tokens than expected often indicate that the model is working harder -- which correlates with lower-confidence outputs. Tracking both together gives you an early signal before the divergence rate climbs.
Maker/checker divergence as the leading indicator
Among all these signals, maker/checker divergence rate has been the most reliable leading indicator we have seen in production. The pattern is straightforward: a maker node generates a result; a checker node independently evaluates it. When they agree, the result proceeds automatically. When they disagree, the transaction is flagged for review. The divergence rate -- the proportion of runs where checker and maker do not agree -- is a number you can track over time.
In the 19-node financial pipeline, this is the signal that caught the jurisdiction-misclassification case. The checker was not failing on formula correctness -- the maker's calculation was arithmetically right. The checker flagged a tax calculation where the maker was applying the correct formula for the wrong jurisdiction. The code passed all existing tests. The error was upstream, in the classification step that had set the jurisdiction context. The checker recognized that the inputs and the result did not fit together and routed the transaction for human review. (This is the same pipeline described in the first post in this series; that post covers the maker/checker design in detail.)
What made this catch possible was not just the checker's logic but the fact that the divergence rate had been tracked over time. The team had a baseline. When divergence on jurisdiction-related transactions started climbing, it was visible before any incorrect result reached the output layer. The rising divergence was the signal. The human review that followed was the confirmation.
This is what makes divergence rate a leading indicator rather than a lagging one. The maker/checker pattern has a separate post dedicated to its design; this one is about the observability layer that makes it useful in practice. Most monitoring catches failures after they produce bad output. Divergence catches the mismatch before the output is final -- while there is still a path to correction in the same run.
Where teams underinvest
The monitoring setups that most teams build for LangGraph pipelines answer the wrong question. They tell you the pipeline ran. They do not tell you whether it ran correctly.
The gap shows up in a familiar pattern: thorough logging of exceptions and node execution times, careful tracking of API error rates and latency percentiles -- and nothing at all on the reasoning that drove each routing decision. The pipeline is observed as infrastructure. Its decisions are not observed at all.
The consequence is that accuracy drift is invisible until it becomes large enough to produce an output that a human notices is wrong. At that point, the pipeline has often been systematically off for long enough that the problem is difficult to scope and the correction is disruptive. The data that would have surfaced the drift earlier -- the routing decisions, the confidence distributions, the divergence trends -- was never collected.
Closing this gap does not require a separate observability platform or a large instrumentation project. It requires treating routing decisions as first-class data objects from the start: logging the inputs, the model's response, and the confidence at each conditional edge; tracking maker/checker agreement rates over time; and setting alert thresholds on the signals that move before failures occur. The instrumentation is lightweight. The data it produces is the difference between a pipeline that tells you it ran and one that tells you whether it was right.
A structured conversation before you build
If you are evaluating LangGraph for a production pipeline -- or trying to understand why a running one is producing results that look correct but fail on closer inspection -- the most useful starting point is a conversation about the decision architecture before adding instrumentation. The signals worth collecting are determined by the decisions worth watching, and those depend on where your graph's logic is most exposed to drift.
Labyrinth Analytics has built and operated LangGraph pipelines in production for financial data workflows with complex validation requirements and human-in-the-loop review gates. If you want to see what a state-transition observability layer looks like in practice, the work section has case studies with architecture details. If you want to talk through your specific situation, get in touch.
Labyrinth Analytics Consulting builds and advises on agentic data workflows, LangGraph pipelines, and AI-assisted data operations. Questions? info@labyrinthanalyticsconsulting.com